This lesson describes a trading methodology used by systematic traders. Any references below to entries, stops, or targets are illustrations of how the methodology is implemented — they are not personal recommendations, investment advice, or instructions for you to take a specific trade. Every reader's circumstances differ. Always do your own research and consult a licensed financial adviser before making trading decisions.
Exponential Moving Averages (EMAs) are probably the single most used indicator in trading. Every serious trader has a set of EMAs on their chart. But most people use them wrong, or they don't understand why certain EMA values work better than others.
This guide covers everything: what EMAs are, how they differ from simple moving averages, which values to use and why, how to trade crosses and pullbacks, and how to combine multiple EMAs into a complete system.
What Is an EMA?
An Exponential Moving Average is a type of moving average that gives more weight to recent price data. This makes it react faster to price changes compared to a Simple Moving Average (SMA), which treats every candle equally.
The formula applies a multiplier to the most recent price: Multiplier = 2 / (period + 1). A 12-period EMA gives a multiplier of 0.1538, meaning the latest candle gets about 15% of the total weight. An SMA would give each of the 12 candles equal weight (8.3%).
In practice, this means the EMA hugs price more tightly and turns faster at trend reversals. For active traders, this responsiveness is critical.
EMA vs SMA: Why EMA Wins for Active Trading
The debate between EMA and SMA has been going on for decades. Here is the honest answer:
- EMA reacts faster to price changes because recent candles carry more weight. This gives you earlier signals.
- SMA is smoother and less prone to whipsaws. It works well on higher timeframes (daily, weekly) where you want less noise.
- For crypto and intraday trading, EMA is better. Crypto moves fast, and you need your indicator to keep up.
- For long-term position trading, SMA can work fine. But even institutional traders increasingly use EMAs.
Bottom line: if you are trading anything below the weekly timeframe, use EMAs. The faster response time outweighs the occasional false signal.
Why Specific EMA Values Matter
Not all EMA periods are created equal. Certain numbers work better because they align with Fibonacci sequences or institutional trading cycles. Here is why the most popular values are popular:
EMA 12 and 21 (Momentum)
Both 12 and 21 are Fibonacci numbers (the sequence: 1, 1, 2, 3, 5, 8, 13, 21, 34, 55, 89...). Traders discovered decades ago that Fibonacci-based periods tend to produce cleaner signals because markets naturally move in waves that align with these ratios.
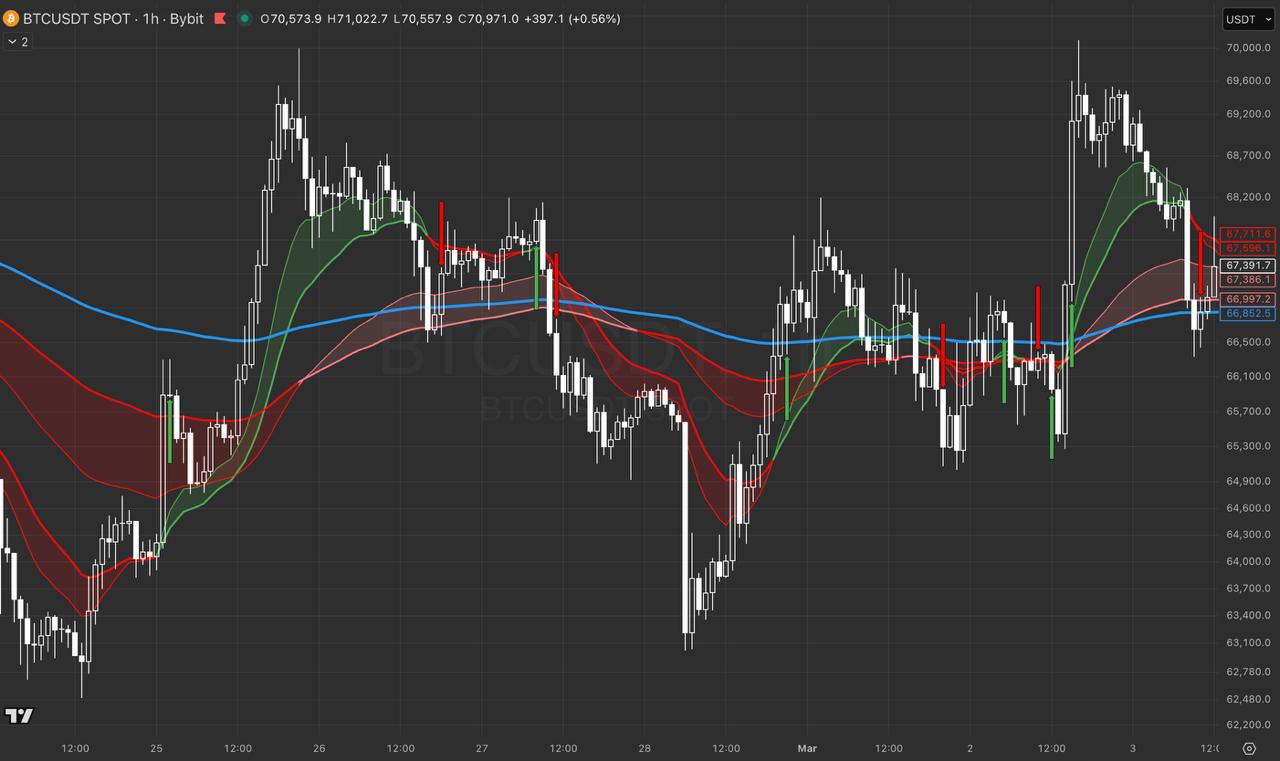
The 12/21 EMA cross is one of the most popular momentum signals in crypto trading. When the 12 crosses above the 21, momentum is shifting bullish. When it crosses below, momentum is turning bearish. On Bitcoin specifically, this cross has historically been a reliable early signal of trend shifts on the 1H and 4H timeframes.
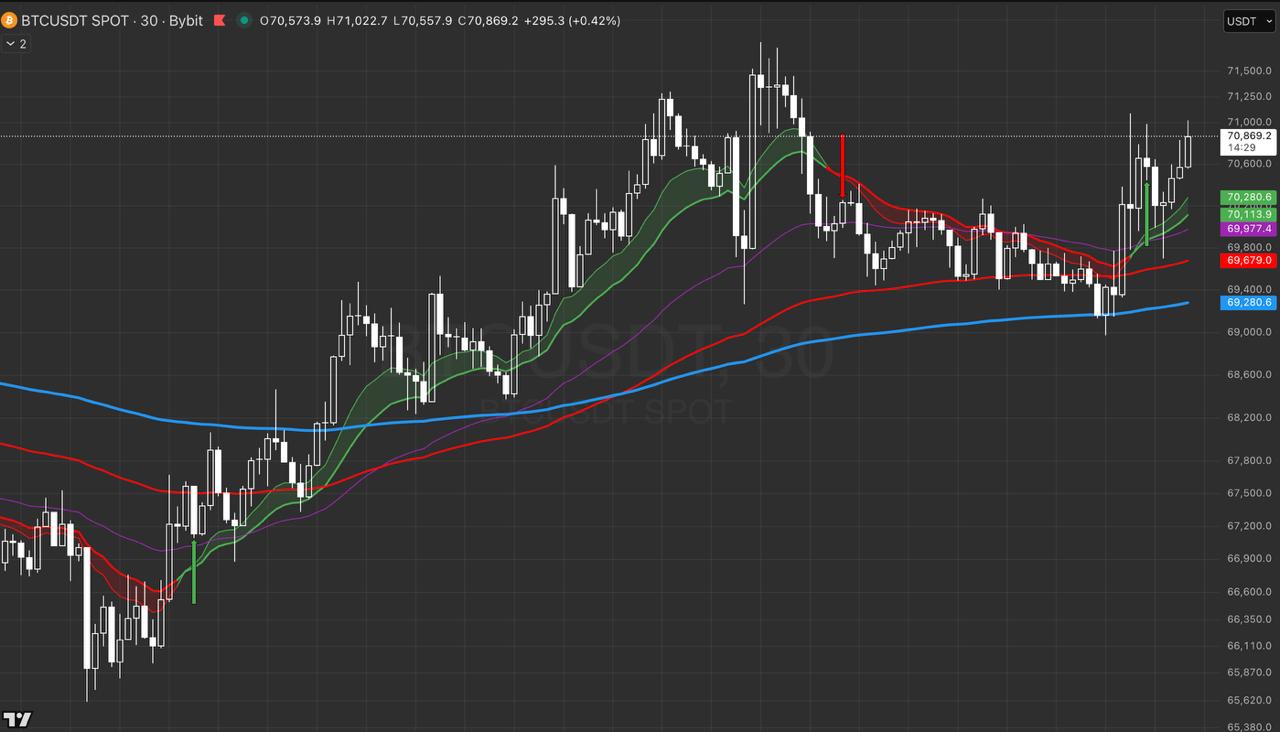
The 12/21 EMA cross in action. EMAs turn green when the 12 crosses above the 21, signaling bullish momentum. Arrows mark the exact cross point.
EMA 50 and 100 (Trend)
The 50 EMA represents roughly 2.5 months of data on a daily chart. It acts as a dynamic support/resistance level that institutional traders watch closely. When price pulls back to the 50 EMA in an uptrend and bounces, that is often a high-probability long entry.
The 100 EMA adds an extra layer of trend confirmation. When the 50 crosses above the 100, it signals that the medium-term trend is firmly bullish. This is a slower signal than the 12/21 cross, but it is more reliable and produces fewer false signals.
EMA 200 (The Big One)
The 200 EMA (or SMA, both are widely used at this level) is the most important moving average in all of trading. It represents roughly one year of daily price data and is used by virtually every institutional trader and fund manager on the planet.
- Price above 200 EMA = bull market. Most trend-following systems only take longs above it.
- Price below 200 EMA = bear market. Short setups become dominant.
- Price touching 200 EMA = major decision point. Expect a strong bounce or a strong break.
On Bitcoin, the 200-day EMA has been one of the most reliable macro indicators. Every major bull run in BTC history has taken place with price above the 200 EMA. Every major crash has taken price below it.
How to Trade EMA Crosses
An EMA cross happens when a faster EMA crosses above or below a slower one. This signals a shift in momentum or trend. There are two main types:
1. The Momentum Cross (12/21)
This is a fast signal. Use it on the 15M, 1H, or 4H timeframe for entries and exits.
- Bullish cross: EMA 12 crosses above EMA 21. Enter long on the next candle close.
- Bearish cross: EMA 12 crosses below EMA 21. Enter short or exit longs.
- Filter: Only take bullish crosses when price is above the 200 EMA. Only take bearish crosses when price is below the 200 EMA.
2. The Golden Cross / Death Cross (50/200)
When the 50 EMA crosses above the 200 EMA, it is called a Golden Cross. This is one of the strongest bullish signals in technical analysis. The reverse (50 crossing below 200) is called a Death Cross and signals a potential major downtrend.
These crosses are slow and don't happen often. But when they do, the resulting moves tend to be large and sustained. On Bitcoin's daily chart, every Golden Cross since 2015 has preceded a significant rally.
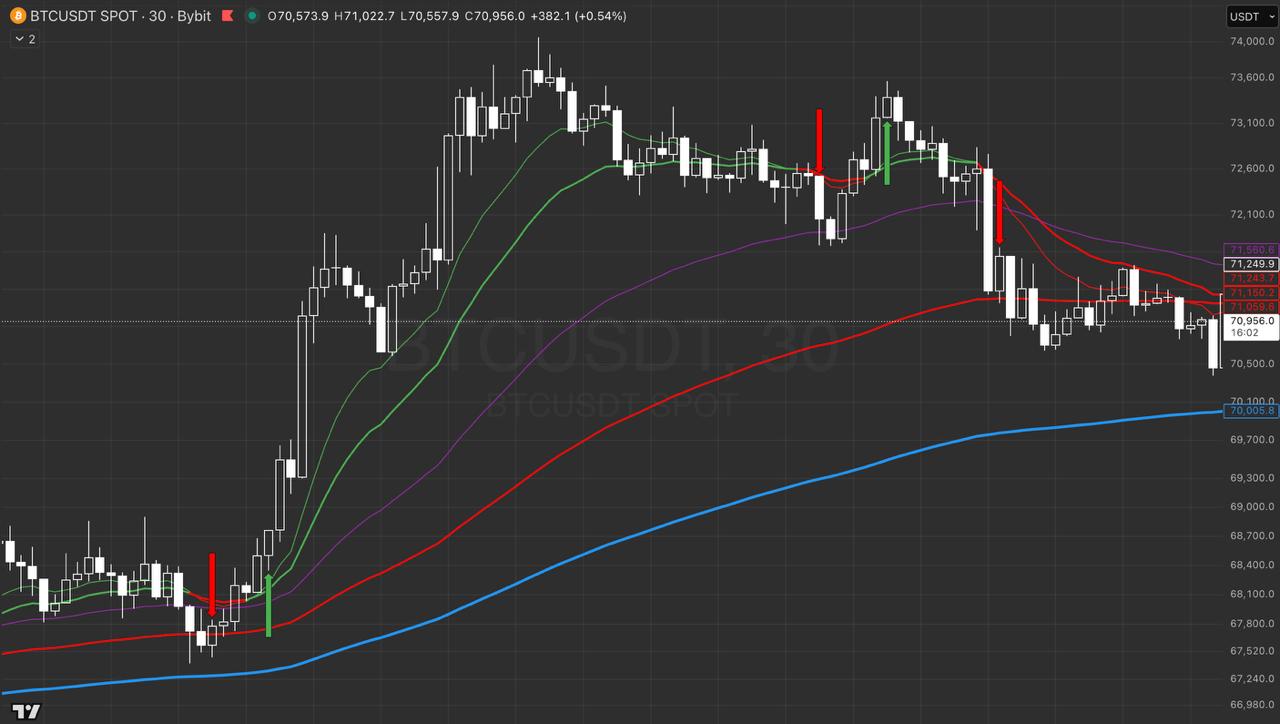
Bearish cross example. When the fast EMA crosses below the slow EMA, the lines turn red and a down arrow appears. Clear visual signal to exit longs or consider shorts.
How to Trade EMA Retests and Pullbacks
EMA crosses get you into a trend. Pullbacks let you add to the position or enter if you missed the cross. This is where EMAs really shine.
The EMA Pullback Entry
- Identify the trend using your EMA cross (12 above 21 = bullish)
- Wait for price to pull back toward the 21 EMA (or the 50 EMA for deeper pullbacks)
- Look for a bounce candle: a candle that touches or wicks below the EMA and closes back above it
- Enter long with your stop loss below the EMA by 1 ATR
- Target the recent swing high or 2R
This works because in a healthy trend, EMAs act as dynamic support. Institutional traders place orders at these levels, creating natural demand zones. The pullback to the EMA is essentially price testing whether buyers are still in control.
The EMA Retest After Break
Sometimes price breaks below an important EMA (like the 50 or 200) and then retests it from below. This retest often acts as resistance. If the candle that retests the EMA gets rejected (long upper wick, closes below), that is a short entry signal.
The reverse is true for bullish retests: price breaks above the EMA, pulls back to it, bounces, and continues higher.
Using Multiple EMAs Together
The real power of EMAs comes from using multiple periods together. Each EMA tells you something different:
- 12 EMA: Immediate momentum (where is price heading right now?)
- 21 EMA: Short-term trend (is the current move sustained?)
- 50 EMA: Medium-term trend and dynamic support/resistance
- 100 EMA: Trend confirmation (slower, more reliable)
- 200 EMA: Macro trend filter (bull vs bear market)
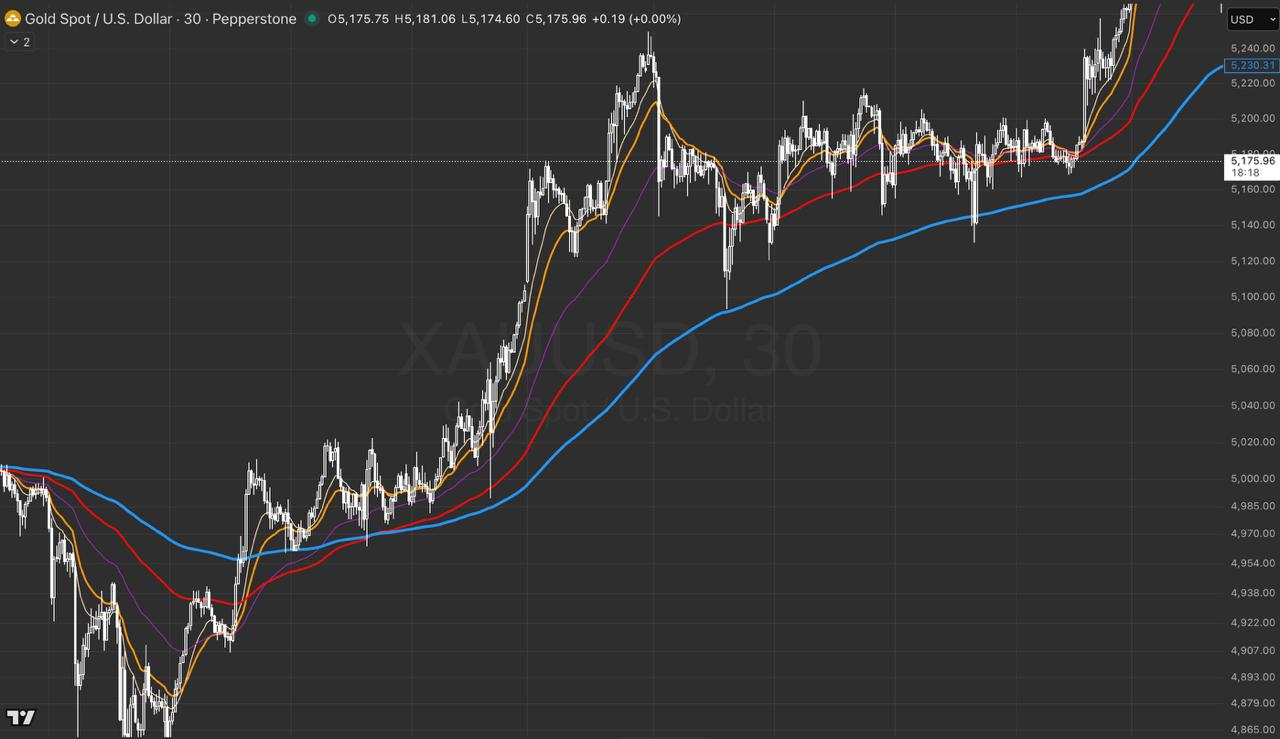
When all five EMAs are stacked in order (12 > 21 > 50 > 100 > 200 for bullish, reverse for bearish), the trend is strong and you should be trading aggressively in that direction. When the EMAs are tangled and crossing each other, the market is ranging and you should stay out.
Fill zones between EMA pairs make it instantly obvious when a trend is active (wide colored zone) vs when it is losing strength (zone narrowing).
The EMA 200 Trend Filter
One of the most effective ways to reduce false signals is to add a 200 EMA trend filter to any strategy. The rule is simple:
- Only take long signals when price is above the 200 EMA
- Only take short signals when price is below the 200 EMA
- Ignore all signals that go against the 200 EMA direction
This single filter eliminates most of the whipsaw losses that happen during choppy, directionless markets. It forces you to trade with the macro trend, which is where the biggest and most reliable moves happen.
Setting Up Alerts
You don't need to stare at charts all day. Set alerts on your EMA crosses and get notified when a signal triggers. Most platforms, including TradingView, let you set alerts on indicator conditions like "EMA 12 crosses above EMA 21" or "Price touches EMA 50."
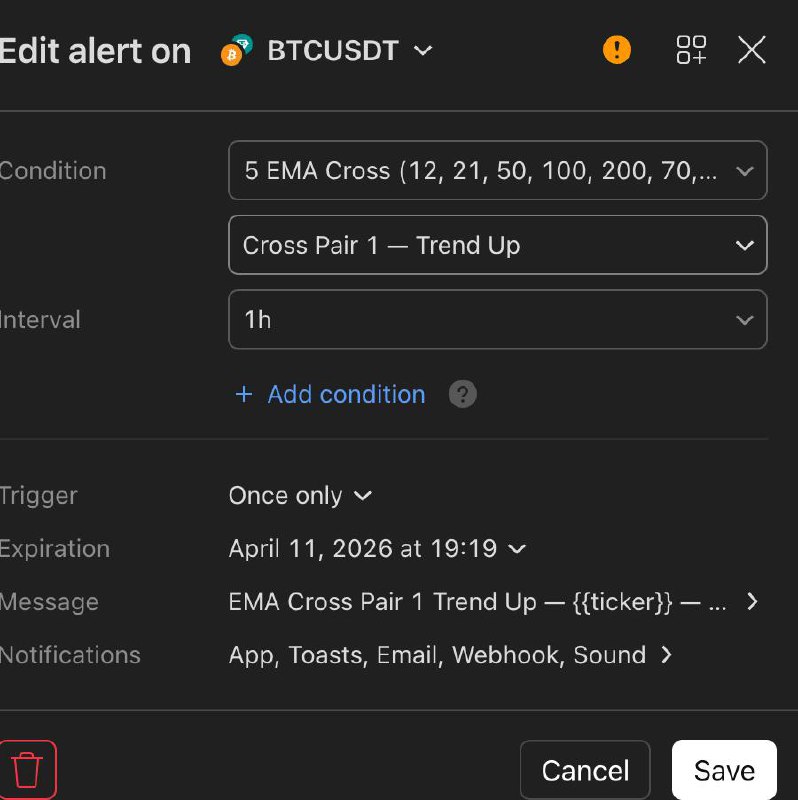
Setting up alerts for EMA cross signals. Get notified on your phone, email, or webhook when a cross happens on any timeframe.
Common Mistakes to Avoid
- Using EMAs in ranging markets. Moving averages are trend indicators. In sideways markets, they produce constant false crosses. Use the 200 EMA filter to avoid this.
- Changing your EMA settings too often. Pick your values and stick with them. Constantly optimizing is a trap.
- Ignoring the timeframe. A 12/21 cross on the 1-minute chart is noise. On the 4H chart, it is a signal. Match your EMA timeframe to your trading style.
- Trading every cross. Not every cross is worth trading. Look for crosses that happen with volume, at key levels, and in the direction of the higher timeframe trend.
Try the 5 EMA Cross Indicator
We built the 5 EMA Cross indicator for TradingView to make all of this automatic. It plots 5 fully customizable EMAs with dynamic trend coloring (green for bullish, red for bearish), optional fill zones between cross pairs, a 200 EMA trend filter, and 6 built-in alert conditions.
Two independent cross pairs let you monitor different EMA strategies on the same chart without switching tabs or adding multiple indicators. It is free and available on TradingView.
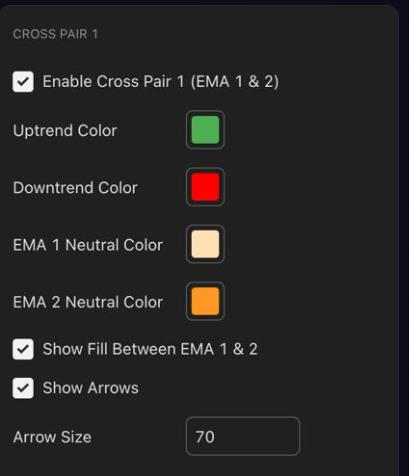
Cross Pair 1 (EMA 12/21): Green for uptrend, red for downtrend. Enable fill zones and arrows for visual clarity.
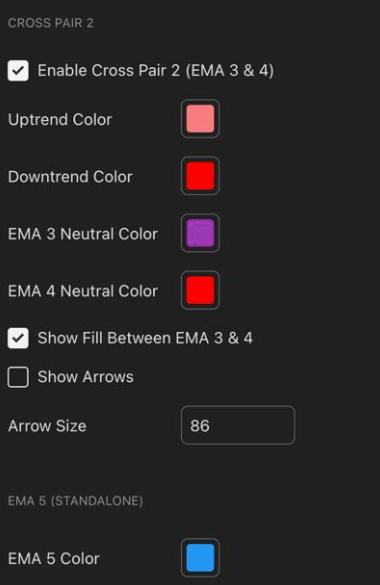
Cross Pair 2 (EMA 50/100): Use different colors to distinguish from Pair 1. The standalone EMA 5 (200) in blue anchors the macro trend.